Big Data and biodiversity
October 28, 2014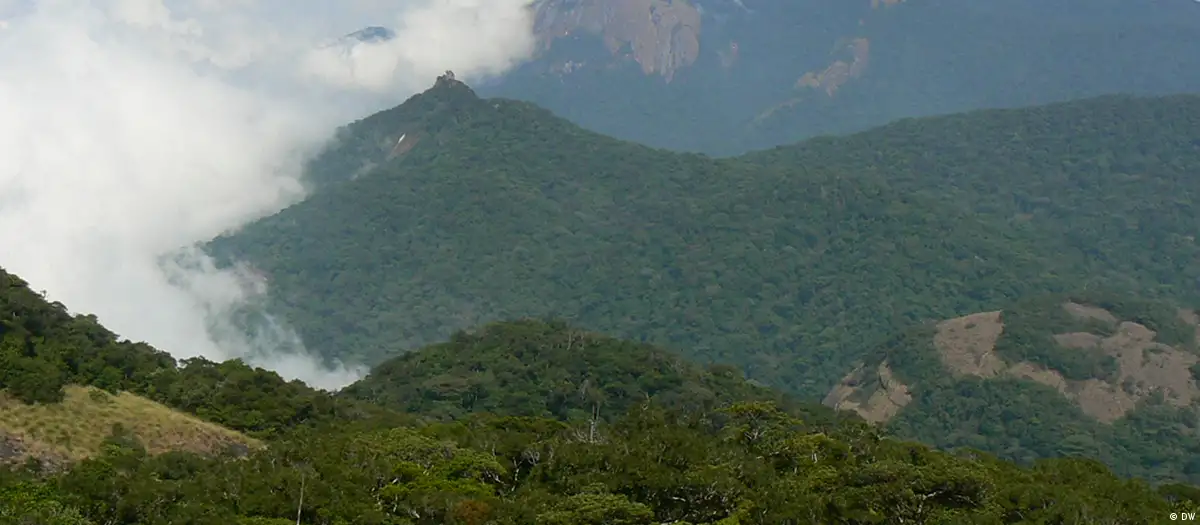
In September, two ivory poachers were arrested in Mozambique after their camp was spotted on Google Earth. According to a report by Mongabay, satellite imagery revealed their vehicle tracks and a small cluster of huts just outside a reserve the size of Denmark.
Julian Bayliss, a conservation biologist in neighboring Malawi, says news of the incident brought back memories of a discovery of his own while in his former job at the Kew Royal Botanic Gardens in the UK: Google Earth revealed an area of dense green vegetation in the mountains of Mozambique, where there were no official records of forest. In 2005, Bayliss and his team went to the spot, which had been largely cut off by decades of political unrest, and discovered the largest rainforest in southern Africa – and a dozen previously uncategorized species.
In the intervening years, technology has continued to evolve, so that today’s biologists might be found tracking down answers to their questions about biodiversity in front of their computer screens, wading through vast amounts of digital data rather than physically exploring physical habitats.
A lot of it is thanks to new imaging techniques. There is hyperspectral imaging, which picks up wavelengths of light from across the electromagnetic spectrum to identify different materials and objects - or particular types of vegetation. Or lidar scanners that emit lasers and detect distance by analyzing their reflection, and geographic information systems (GIS) that compile spatial data. All of these now provide three-dimensional imaging with detailed information about terrain.
“You can look at the three-dimensional architecture of the forest,” says Bayliss, “and based on its contours and maybe the water courses inside it, it would give you a better understanding and a clearer picture of exactly what's there before you visit on the ground.”
Remote sensing is effective at monitoring environmental damage such as deforestation and can be combined with other data – for example on climate, or from GPS-tagged animals – to make predictions about what species might be found in a given area.
Interdisciplinary challenges
As valuable as they might be to biologists, for the most part, these technologies were developed not with conservation or biodiversity research in mind, but by geographers working with governments to plan land use for development and identify resources for mining.
That biologists quickly realized the potential of remote sensing for their work has not only forced them to learn new skills in order to take advantage of the new technological opportunities, but also required an integrated approach between disciplines traditionally separated in different university departments.
Kamran Safi, a biologist at the University of Konstanz and laboratory head at the Max Planck Institute for Ornithology’s department for migration and immuno-ecology, says that can be tricky: geographers, engineers and biologists often use different terminology, and the academic rewards for interdisciplinary research can be limited. Still, such collaborations are already shaping developments in remote sensing.
“This synergy is happening right now,” said Safi. “The remote sensing community is acknowledging a change in focus – that it might be moving away from human-related questions to more ecosystem-related questions.”
Visualizing the data
The new wealth of environmental data is also driving interdisciplinary approaches to journalism – as evidenced by projects like InfoAmazonia, which makes satellite data revealing logging, fires and mining in the Amazon accessible through interactive maps.
“I had the idea of creating a hub where you could both read the news and look at the data at the same time, allowing you to see the correlations – treating journalism as a layer of information that interacts with data coming from satellites,” said InfoAmazonia’s founder Gustavo Faleiros. “To do that I had to engage with a lot of programmers and designers.”
InfoAmazonia now uses a range of datasets from other sources – not just on environmental damage but also on human health, sanitation and forced labor with stories and videos providing context.
Users can view and compare different datasets on the site to visualize the impact of human activity in the Amazon rainforest. But when it comes to the big questions in biodiversity science, making sense of the relationships holding together an entire ecosystem is a challenge on another scale.
“How do species coexist? This is the holy grail of ecology… ” said Safi. “And one thing I find extremely interesting, and extremely hard to tackle, is how to see the whole complexity of ecosystems – the intricate web of interactions between the species – and what happens to the whole system if you pull on one string.”
Safi warns that rather than more information leading in a linear fashion to greater insight, it will present new problems in terms of how to make sense of such huge volumes of data.
Open data and digitizing the past
The Global Biodiversity Information Facility (GBIF) was set up in 2001 to share biodiversity data from museums and research institutions around the world. It makes freely available datasets from the most high tech sources requiring highly specialized work – such as genetic sequencing – to observations by amateur naturalists and citizen scientists.
“You could consider all of those around the world who are interested in nature and have a digital camera as almost a big sensor network,” said Donald Hobern, executive director of GBIF. “It does turn up interesting things. I have an interest in a family of moths called plume moths. The second known individual of a species of plume moth from Taiwan turned up in a picture on Flickr.”
It’s not how big your dataset is – it’s what you do with it
GBIF’s digital records have now passed the 500 million mark and, among many other uses, are being harnessed to track the spread of invasive species, model the impact of climate change on biodiversity, identify areas in urgent need of protection, and monitor the effectiveness of conservation programs.
“What we are trying to achieve here is to provide the tools to build the best possible digital model of the probability of encountering any species in time and space,” said Hobern.
“What we’ve got today is a lot of data records but probably not yet enough modeling on top of it to understand the significance.”
Safi describes this as a transitional period in which the challenges are less about gathering data than understanding what to do with it. He warns his students at the Max Planck Institute that before heading out into the field, they have to prove the data they need is not already available.
“We are not making full use of the data we have already collected,” said Safi. “We owe it to the previous generations of scientists who collected these datasets, but also we owe it to the animals that have been carrying around tags or been used in animal testing environments to provide us with data, and to taxpayers – we owe it to the whole system that we use the data efficiently.”